

Below is a look at one of the trades that closed this week. It is high level and most of the concepts have not been discussed in detail in any earlier post. The annualized 130.41% return on capital employed (ROCE) should be a concept you are familiar with!
Entry and Unit Size
On July 23 one of the scans noted that Constellation Brands (STZ) was oversold. STZ is a wide-moat dividend paying stock that is a leader in the high end Mexican imported beer market. Entry was made at $137.42. The unit size for purchase is $1,000 so all calculations are based on a per-$1,000 basis. Share purchases are rounded either up or down from there. On 7/23 the purchase was 7 shares.
Anchor Point & Scale In/Out
Based on the $137.42 purchase price the Anchor was set at $137.00. In this case the rounding to $137.00 was down but note this is not critical to the trade. The anchor just needs to be set near the entry price of the first unit. Now comes the scaling.
As you know the Fibonacci sequence begins 0, 1, 1, 2, 3, 5, 8. Here’s how the sequence fits into the system. At 0, no shares are owned. At the initial purchase, 1 unit is bought and establishes the anchor. The next purchase is 1 unit at 1% less than the anchor rounded to $0.25. This is the scale width. For the STZ campaign the width is $1.25. There will be more on the scale width in future posts but for this system it is either 1 or 2 percent. The next number in the sequence is 2. The next scale level is 2 units at 2 “widths” below the earlier buy level. So the buy is 2 units ($2,000) at $133.25. This would be 15 shares. The next number in the sequence is 3. That would be 3 units at another 3% discount to the earlier purchase, which was $129.50. This is as deep as the scale went for this campaign. On 7/6/2026, STZ had a huge range, and shares were bought all the way down to the $129.50 tranche.
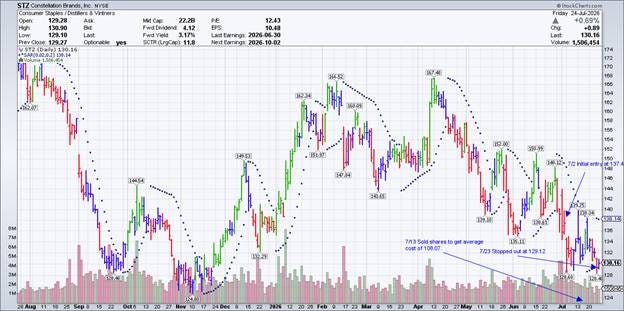
At this point the Fibonacci sequence was reversed for the scale out beginning at $130.75. As you can see there was buying and selling between 7/7/2026 and 7/13/2026. This generated some nice production, lowering the cost of the campaign. On 7/13/2026 STZ hit $138.25 (1% above the anchor). Rather cash out the remaining 22 shares, this system strives to get the campaign cost of 1 unit below some trailing stop loss. This locks in a profit for the campaign and looks to catch large trend (at no added risk) for the remaining unit. So 15 shares were sold and campaign cost for the final unit of 7 shares was $108.07.
For this campaign J. Welles Wilder’s Parabolic Stop and Reverse is the indicator of choice (discussed in detail in an earlier post). See Chart (courtesy of StockCharts). The stock trailed up for a couple of days but was stopped out on 7/23/2026 at $129.12.


Return On Capital Employed (ROCE)
This is where the swing or short-term system passes muster. The only reason to trade short term is to capitalize on the turnover and velocity of money. To calculate, the amount invested each day is aggregated into the Sum of Capital days then divided by the number of days in the trade to get to the Average Debit. This is the average daily dollar amount tied up in this campaign. From there we get a Total Return of 7.5%, a daily return of 0.357% (Note: a prop firm mentor used a target of 0.1% for a daily ROCE) and an annualized return of 130.41%.

This is an example of a campaign that closed at lower price than the entry yet returned 130.41% annualized. It’s a robust system anyone can learn. Subscribe and change your trading mindset.
Go to the Public Trading Log for more details.
Stay Tuned!
Disclaimer: This is not advice and is for information and educational purposes only. All trades are made under strict position sizing rules.