

First a portfolio update:
At present we have 4 stocks in the portfolio.
NKE - NKE made a quick pop the day after purchase. Sold 0.5 units at $42.00 for a 5% gain. Average cost for remaining 0.5 unit is $37.42. In trend mode. Stop loss for Monday is $40.39. Current gain per unit is $6.95.
AVGO - After 1 scale AVGO made a 5% move from the buy point. Sold 0.5 units for $388.00 for an average cost of 327.06 on the remaining 0.5 unit. Stop for Monday is $357.20. Current gain per unit is $72.91.
STZ - STZ made 10 trades this week. The original buy in was 137.42 for 1 unit. The scaling has increased the number of units to 3 and reduced the average cost to $128.94. Orders in for Monday to buy 2 units limit $132.00 and sell 2 units at $138.25 holding 1 unit for trend mode. Current gain per unit is $5.12.
APH - APH was a new add this week. Bought 1 unit at $156.90. Orders in to buy 1 unit at 153.75 and sell 0.5 units at $165.00 and retain 0.5 units for trend mode. Current gain per unit is $2.16.
For public tracking, the portfolio management count is 5 stocks or ETFs in scale mode with no limit on trending. Unit sizing and campaign count in an actual account will be discussed in a later post. All trades can be tracked on my Trading Journal.
Now on to Scale Trading with the Fibonacci Sequence.
Scale Trading
I would guess that most active traders are familiar with the concept and process. but as an intro to the post or for those not familiar with the process, scale trading is a risk-managed approach to building or exiting stock positions incrementally rather than all at once. Instead of committing full capital at a single price, a trader buys (or sells) smaller “scales” or portions of the intended position at predetermined price levels as the market moves in their favor or against them. This technique is especially popular in volatile or trending stocks because it lowers average entry cost on pullbacks, reduces emotional decision-making, and allows traders to stay active across a range of prices while controlling overall exposure. In practice, a scale trader starts a position at the initial entry with a fraction of their total commitment. If the stock drops add to the position, turning what could be a single high-stakes bet into a series of measured, probability-weighted steps. Scaling out capitalizes on volatility to capture small profits, reducing the trader’s average cost of the campaign. There are as many ways to exit the campaign as there are traders. I prefer to work a campaign until the average cost is at a point where I can lock in a win and let the rest ride and see if a nice trend emerges. If not, I’ll get stopped out for a small gain.
Something to note, scale trading has its risks which must be managed. While in scale mode I do not trade with a conventional price stop. I set a dollar stop on the campaign based on a percentage of my account size. I use the classic 2% (of account size) as the maximum loss per campaign. This and unit sizing are the ultimate weapons against getting whipsawed - the enemy of many trading strategies.
The Fibonacci Sequence
As with the method of scale trading most active traders are familiar with Fibonacci retracements. What I’m talking about is the actual sequence. The Fibonacci sequence (0, 1, 1, 2, 3, 5, 8, 13, 21, 34, …) is the simple additive series in which each number is the sum of the two numbers before it. In scale trading, the sequence itself provides a natural, accelerating progression for building stock positions. A trader can allocate shares or capital according to the numbers in the series—starting with a small 1-unit scale, adding another 1-unit scale, then 2 units, 3 units, 5 units, and so on if price continues to drop. This creates an organic, mathematically elegant way to increase exposure gradually: early scales remain modest to limit risk, while later scales become larger only after the trade is proving itself. Because the sequence grows at a rate that mirrors many market momentum patterns, it helps traders size their entries in harmony with the accelerating or decelerating nature of a stock’s move, turning position building into a disciplined, self-similar process rather than arbitrary increments.
In addition to the size of the allocation, the Fibonacci sequence can also govern the distance from the anchor (original purchase price). This creates an especially powerful compounding effect on the cost basis when scaling down. A trader might begin with an initial purchase at the anchor price, then add the next scale 1% lower (1 unit), the following scale 2% lower (2 units), then 3% lower (3 units), 5% lower (5 units), 8% lower (8 units), and so on—using the sequence numbers simultaneously for both the percentage distance and the relative size of each new tranche. This dual application means the largest purchases automatically occur at the deepest, most discounted levels farthest from the anchor. The exponential growth in both spacing and volume heavily weights the overall position toward cheaper shares, dramatically lowering the blended average cost basis compared with equal-sized or equally-spaced averaging. Early risk stays contained by the small initial scales close to the anchor, while the mathematics of the sequence ensures that any recovery needs to travel a shorter distance to reach breakeven and generate outsized gains on the larger, lower-priced portions of the campaign. The combination of size and distance make scaling in with the Fibonacci sequence mathematically superior to conventional scaling grids.
Hypothetical Case Study
Below is a comparison of 3 methods of scaling in and out of a stock. It assumes an initial purchase of stock at $100/share, a unit size of $1,000 and each day declines 1% in value until it reaches $81, a 19% drop (the 19% drop is where we would reach the 8-unit layer in the Fibonacci sequence). Subsequently it recovers and we sell at $101. The stock has gone virtually nowhere but in all 3 methods the trader has walked away with a gain. Note: I know stocks don’t perform this symmetrically, but it is sufficient to illustrate the differences of the Fibonacci scale in.
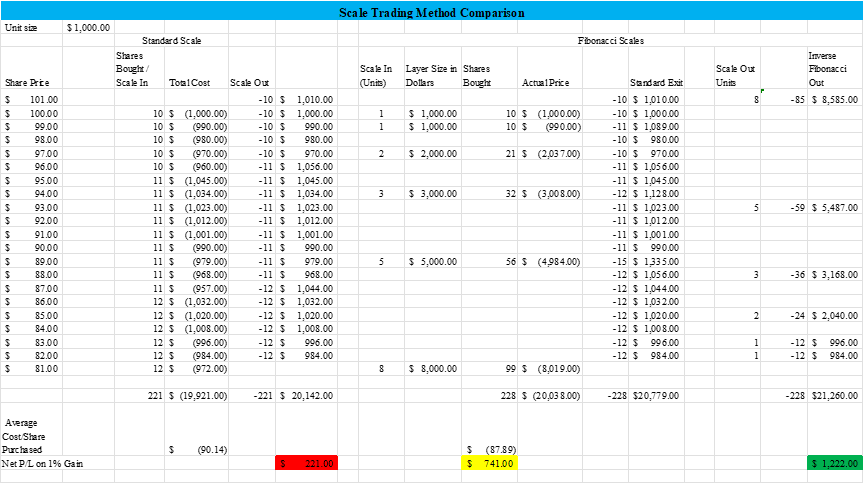
Method 1 - Conventional scale in and out. When the stock drops 1% another unit is purchased. As the stock recovers 1 unit is sold at 1% more than it’s purchase price. The unit size is $1000. Total shares bought - 221. Total cash outlay - $19,921. Average share cost at bottom - 90.14. The result, a gain of $221.
Method 2 - Scale in with the Fibonacci sequence and scale out with a conventional scale out. Total shares bought - 228. Total cash outlay - $20038. Average share cost at bottom - $87.89. The result upon recovery, a gain of $741.
Method 3 - Scale in and out using the Fibonacci sequence. Total share bought - 228. Total cash outlay and average share price at bottom will be the same as Method 2. The total gain, however, is $1,222. Better than Method 2 and substantially better than Method 1.
Method 3 does, however, have a slight drawback. By holding onto more shares for longer the return on capital employed each day is fractionally reduced compared to Method 2. The figure below is a comparison of return of capital employed (ROCE).
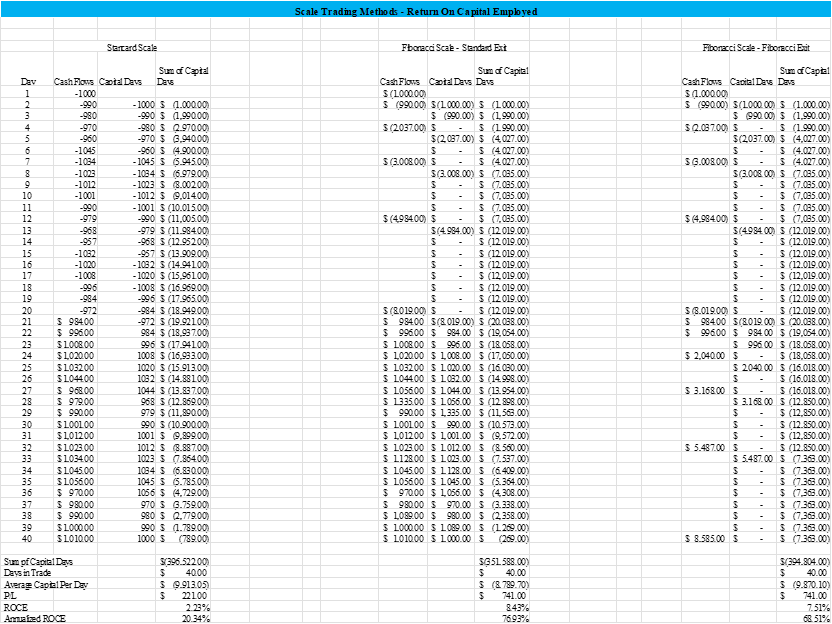
As you Method 1 had an annualized ROCE of 20.34%. Methods 2 and 3 were both over 3 times that amount (76.93% and 68.51% respectively). Method 2 outperformed Method 3 by a slight amount but that too, has a drawback. Scaling at 1% increments over a portfolio of stock turn into a day-trading activity unless automated. Most people don’t have time for that. Limit orders for Method 3 can be placed before or after trading starts and not interfere with the day job. A quick look and maybe some entries/adjustments at lunch maybe optimal but the wider scales make for a more swing trading feel.
Conclusion
Obviously this was a simplistic comparison. Stocks don’t move with that symmetry. There is an infinite number of potential prices moves within that range. It is, however, a certainty that those moves will be either up or down. Scaling in and out will capture harvest that volatility. The purpose of this post was twofold: 1)to introduce the framework of scale trading using Fibonacci sequence and 2) to provide an example of it’s mathematical superiority to conventional scale trading.
Hit Subscribe if you want to read about I deal with unit sizing, scale width selection, cash management and risk management in total. We’ll also review some trades in detail. It’s free!
Stay tuned!!
Al
Disclaimer:
This article is for educational and illustrative purposes only. It is not financial advice, investment advice, or a recommendation to buy or sell any security. Trading stocks involves substantial risk of loss and may not be suitable for all investors. Always conduct your own research and consult a qualified financial advisor before making any investment decisions. Past performance does not guarantee future results.